Dashboards
Consolidated Time period selection for Alerts/tickets tiles Enhancement
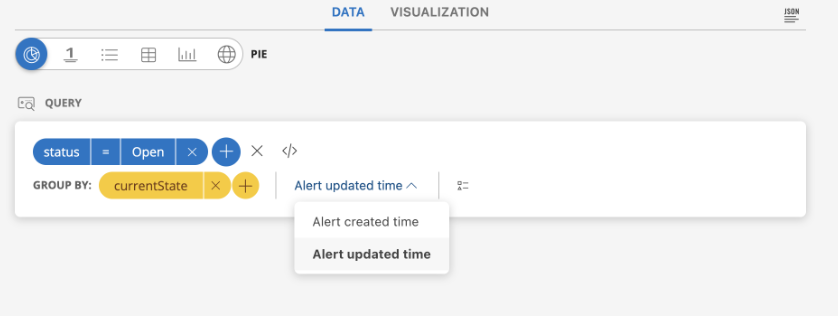
The query time period selection in Alert & Ticket tiles will now be consolidated to Created Time and Updated Time period of the entities.
All previously configured entities under Alerts and Tickets will use Updated Time by default. Alerts and tickets will now display based on their Updated Time.
Ability to sort based on state in OpsQL Enhancement
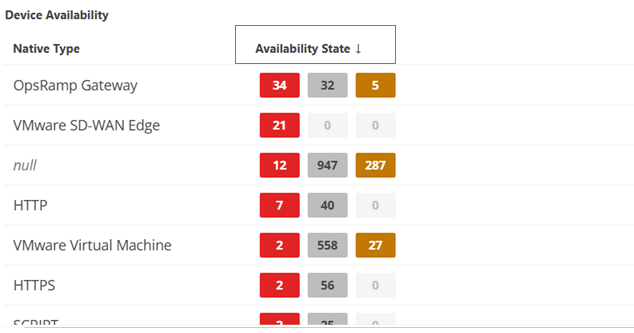
You can now sort results based on the state attribute in OpsQL queries. This enhancement helps you quickly identify resources by their availability state, so you can bring the most affected clusters to the top instead of manually searching through the table.
This sorting capability also applies to OpsQL-based Alert and Incident tile types, giving you consistent and prioritized visibility across dashboards.
Enhanced Dashboard Variable Management Enhancement
A new, streamlined UX for managing Dashboard variables makes configuration faster and more intuitive.
Key Enhancements:
- Simplified Interface: A redesigned Dashboard variable interface reduces the steps required to set values.
- Expanded Variable Support: You can now create Dashboard variables for Resources, Tickets, Alerts, Metrics, and Net-Flows.
- Flexible Value Retrieval: Variables can fetch values with or without queries, offering greater flexibility.
- Mandatory Default Value: Each variable requires a default value, which is clearly highlighted for visibility.
- Filtered Selections: You can apply filters to ensure Dashboard variables display only selected values.
Note
The new UX is fully compatible with existing clients and previously defined Dashboard variables, ensuring a smooth transition.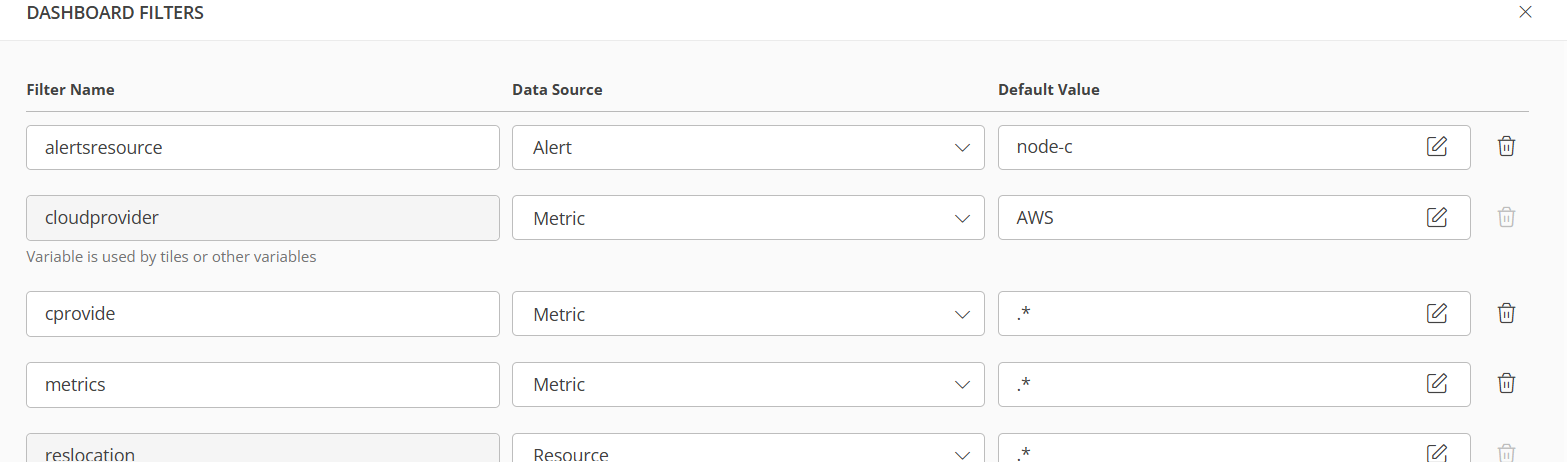
Core Platform
Reverse Direction in Topology Maps Enhancement
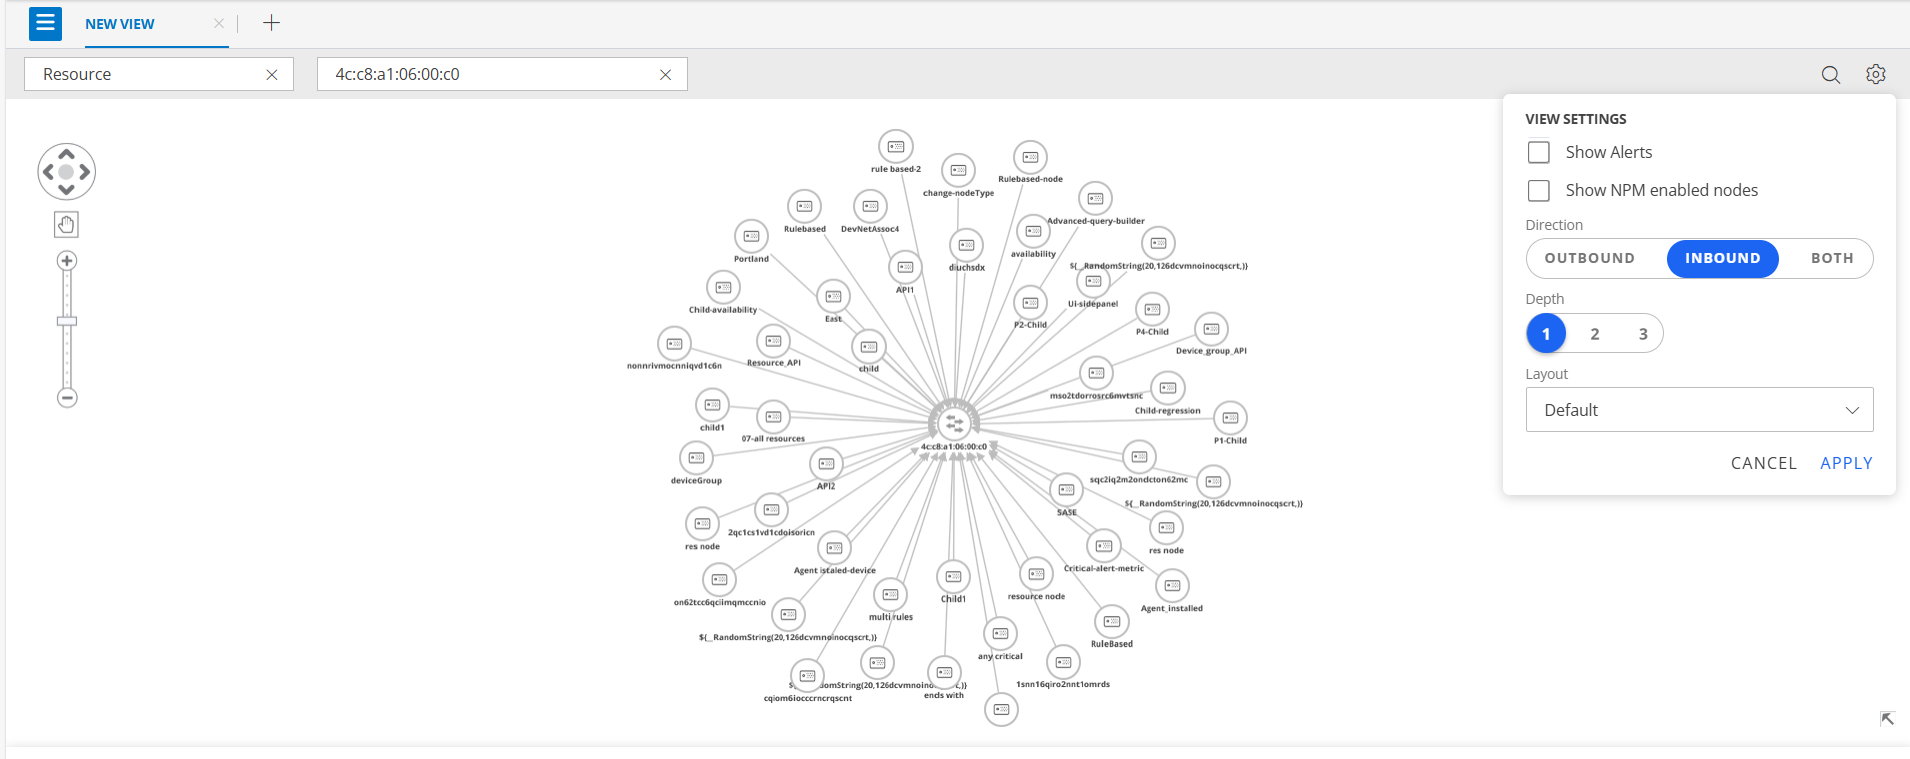
The Reverse Direction feature in Topology Maps provides greater flexibility for visualizing and analyzing bidirectional relationships.
Key Highlights:
- Inbound and Outbound Views: Switch between inbound and outbound to see relationships between nodes from both directions.
- Improved Troubleshooting: Identify upstream and downstream dependencies quickly for faster root-cause analysis.
- Custom Visualization: Change link direction to match how your workflows operate or to focus on the analysis you need.
This enhancement delivers clearer insights into dependencies and relationships, making complex topologies easier to understand and manage.
Enhanced Gateway Visibility in Collector Profiles Enhancement
Gateway visibility has been enhanced in the Collector Profiles page, including display of Gateway type (NextGen, Classic, Windows), model number, and namespace columns for NextGen gateway types.
Resource Management
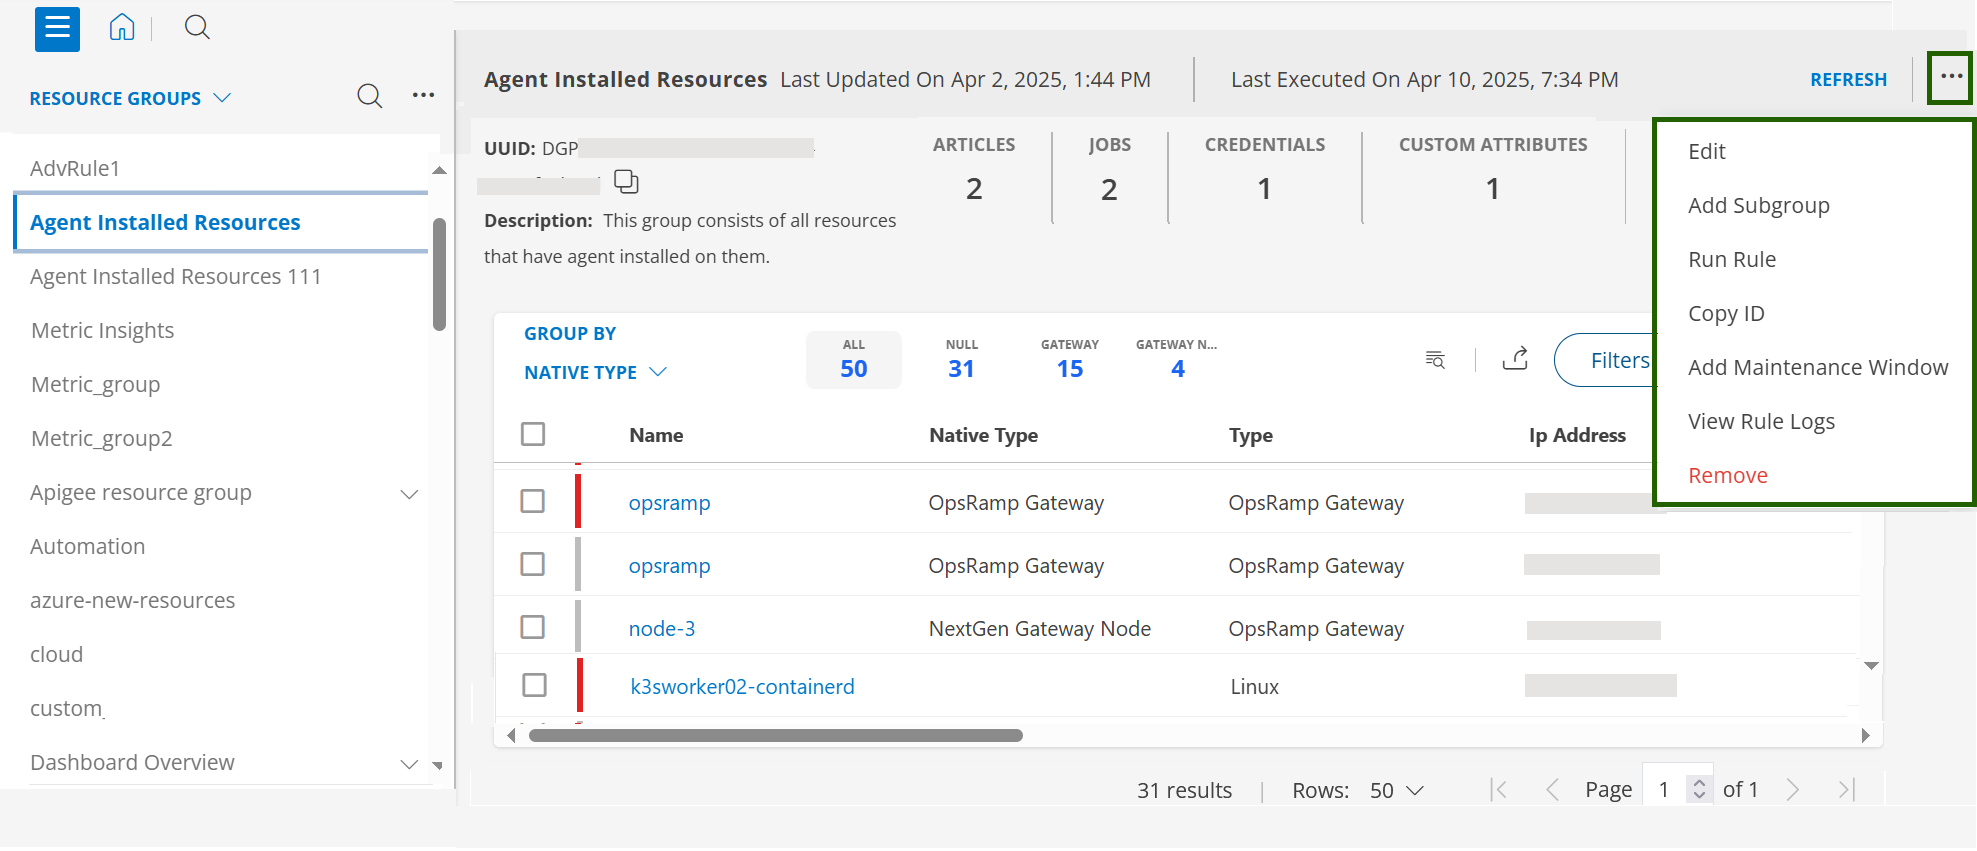
Reusable Component Menu for Groups and Sites Enhancement
A reusable component menu has been implemented for Groups and Sites, featuring a menu on the right side that mirrors the functionality and options of the existing left-side menu.
Key Benefits:
- Consistent User Experience: Provides similar options on both sides for easier navigation and management.
- Improved Accessibility: Enhances usability by offering an alternative menu placement.
Log Management
Support filtering for alias names in the advanced query builder Enhancement
Alias Names used in the advanced query builder now support filtering.
Service Maps
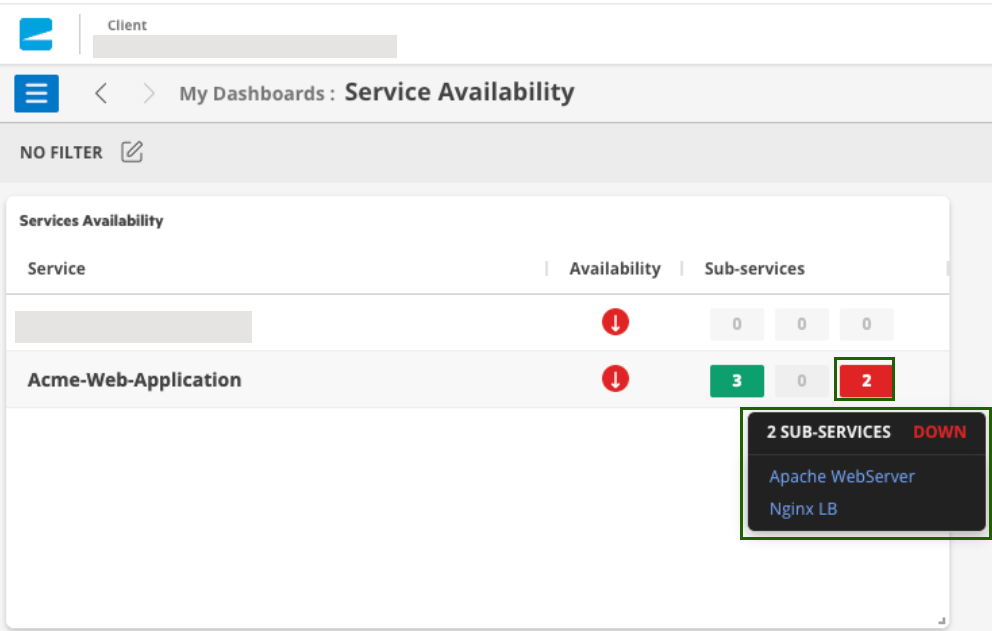
Improved Navigation for Subservice Nodes in the Service Map Dashboard Enhancement
When you click a subservice node in the Service Map dashboard, the system now opens the detailed view for that subservice directly. This enhancement eliminates extra navigation steps, making it quicker and easier to access node details and troubleshoot issues.
Previously, clicking a subservice always redirected you to the Service Map root node, requiring you to manually search for and reselect the subservice.
Monitoring Management
Applied Time Now Visible for More Templates Enhancement
OpsRamp now shows the Applied Time for agent status, gateway tunnel, public cloud, and SaaS-apps monitoring template.
This update makes it easier to track when templates are assigned to your resources.
Monitored Services Information in Inventory Enhancement
The Monitored status in the Resource → Inventory → Services → Monitored column now indicates whether a Windows service is being monitored using the Windows Service Monitoring G2 template.
Previously, the status was only shown for the Windows Service Monitoring G1 template. Now, support has been extended to include the G2 template as well.
With this enhancement, you can directly see which Windows services are being monitored using the G2 Windows Service Monitoring template.
Note
This feature is available only if your agent version is 19.2.0 or above.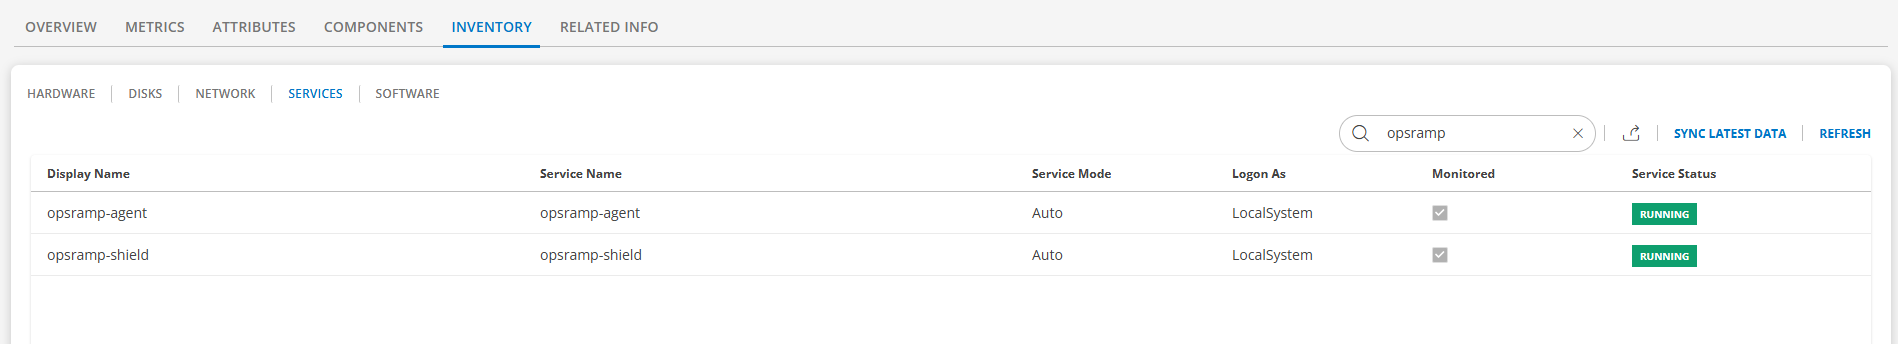
Patch Management
Improved Notification Timing for Scheduled Jobs
Previously, email notifications were sent 2 hours after the scheduled start time of a job. With this update, notifications are now triggered immediately upon job completion, ensuring faster communication and improved workflow efficiency.
Process Automation
Custom Alert Tag Support Enhancement
Added support for custom alert tags in Process Automation. Users can now include custom tags on alerts generated or updated by automation tasks, ensuring consistent tagging across automated alert workflows.
Jenkins Outbound Connector in Process Automation Enhancement
A new Jenkins outbound connector service is now available in Process Automation. This integration enables users to automate Jenkins CI/CD operations directly from OpsRamp workflows. You can authenticate with your Jenkins instance and perform common DevOps actions, including triggering builds, retrieving build status, fetching build information, and stopping running builds.
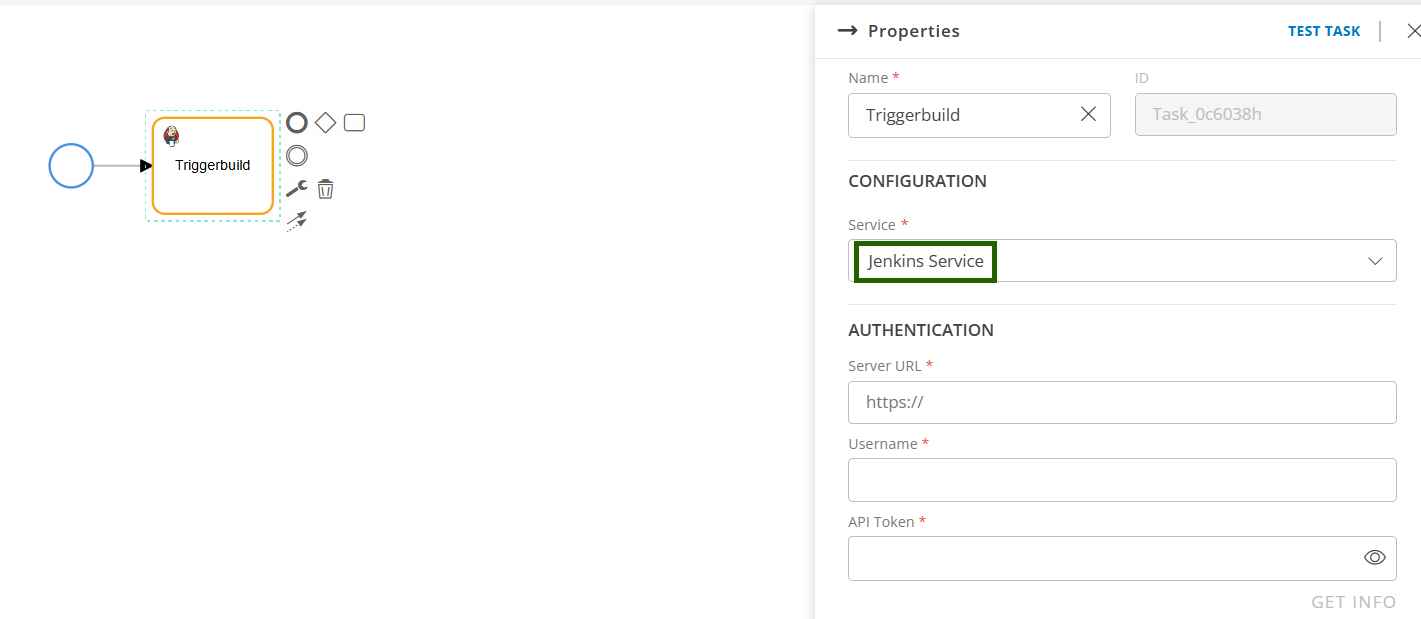
See Jenkins Service documentation for more details.
NPM
Auditing for NetFlow activities Enhancement
Audit logging is now supported for key NPM configuration areas: 1. NPM Retention Policy / Retention Size Limit: All changes made to NPM data retention policies and retention size limits are now captured in the audit log. 2. Custom Metrics: Creation, modification, and deletion of custom metrics for NPM are now audited, providing visibility into metric definition changes for the troubleshooting. 3. Port Mapping: Updates to port mapping configurations are now tracked in the audit log.
Reporting Apps
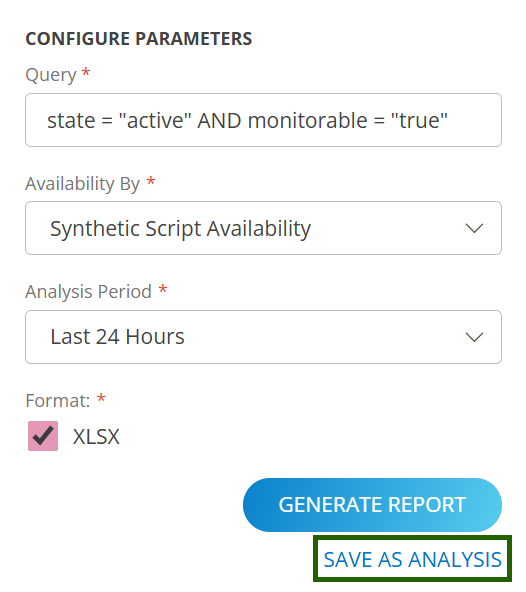
Option to Save Analysis Before Running Report Enhancement
There is now a SAVE AS ANALYSIS button below the Generate Report button in the configuration parameters section of each reporting app. This new option will save an analysis before generating the on-demand report. This feature streamlines the workflow and reduces unnecessary clicks.
Multiple Client Selection in Availability Details App Enhancement
The Availability Details app now offers the capability for users to select multiple clients within the Partner scope, with a maximum limit of 50 clients per selection. This enhancement enables users to generate reports based on specific client criteria rather than to all clients. By utilizing this feature, users can efficiently filter and retrieve only the relevant client data they need, significantly reducing the manual effort.
Individual Username Selection Required on Login Activity and User Details Apps Enhancement
The User Details App and Login Activity App now include a search filter to view specific users' information in the reports. There is an Included Users dropdown menu to filter users by tenant or individual user. The dropdown offers two options:
Specific users across tenants: Selecting this option reveals a new dropdown menu listing users by tenant. For the Partner Scope App, it includes partner users as well as users from each client, labeled with the tenant name as the header. Users can select the desired users across tenants and generate the report.
All users for specific tenants: This option lists all tenants. If a user selects a tenant, the report will include all users associated with that tenant. For the Partner Scope App, users have the flexibility to choose a specific client, multiple clients, or all clients and generate the report.
Public Cloud
Additional Azure Resource Support Added Enhancement
OpsRamp now extends Azure discovery and monitoring coverage to include additional Azure resource types, enhancing visibility and operational oversight across your Azure environment.
Newly supported Azure resources:
- Azure Container Apps Environment
- Private DNS Zone
- Static Web App
- Private Link Service
- Azure Managed Grafana
- Azure Bastion
These additions enable broader monitoring and improved observability for modern Azure workloads and networking components.
Additional Alibaba Cloud Resource Support Added Enhancement
OpsRamp now extends discovery and monitoring capabilities to additional Alibaba Cloud services, improving visibility across Alibaba Cloud environments.
Newly supported resources include:
- NAS File System
- NAT Gateway
- Elastic IP (EIP) Address
- API Gateway
- MaxCompute Project
This enhancement enables more comprehensive monitoring and management of Alibaba Cloud infrastructure within OpsRamp.
Enhanced Google Cloud Monitoring: Updated Metrics & G2 Template Support Enhancement
With this release, standardized G2 monitoring templates are introduced, metrics are aligned with the latest Google Cloud updates, and enhanced visibility is provided across core GCP compute, storage, database, and networking services.
Key highlights:
- Unified and standardized G2 monitoring templates
- Improved metric accuracy aligned with Google Cloud updates
- Deeper insights across supported Google Cloud resource types
Note
- Global G2 monitoring templates and global Discovery & Monitoring Profiles (DMPs) are now available for all supported Google Cloud resources.
- Both G1 and G2 templates continue to be supported for Google Cloud resources.
- When both G1 and G2 templates are applied to the same resource, G2 templates take precedence, and only G2 metrics are collected.
VeloCloud Integration Enhancements: Optimized API Mode for Rate-Limit Handling Enhancement
A new Use Optimized API Version (Recommended) option is available in the VeloCloud integration. When enabled, Enterprise-level APIs collect key metrics for all resources in a single request at the configured polling frequency, significantly reducing API calls and minimizing 429 rate-limit errors. The existing Legacy (resource-level) mode remains supported, and users can switch between modes at any time.
New VMware SD-WAN Edge Link State:The resource type vmware_sdwan_Link_VPN_State now includes a new state:
- State 3 – Dead
This enhancement provides clearer and more accurate visibility into SD-WAN link health and connectivity conditions.
Integration Framework
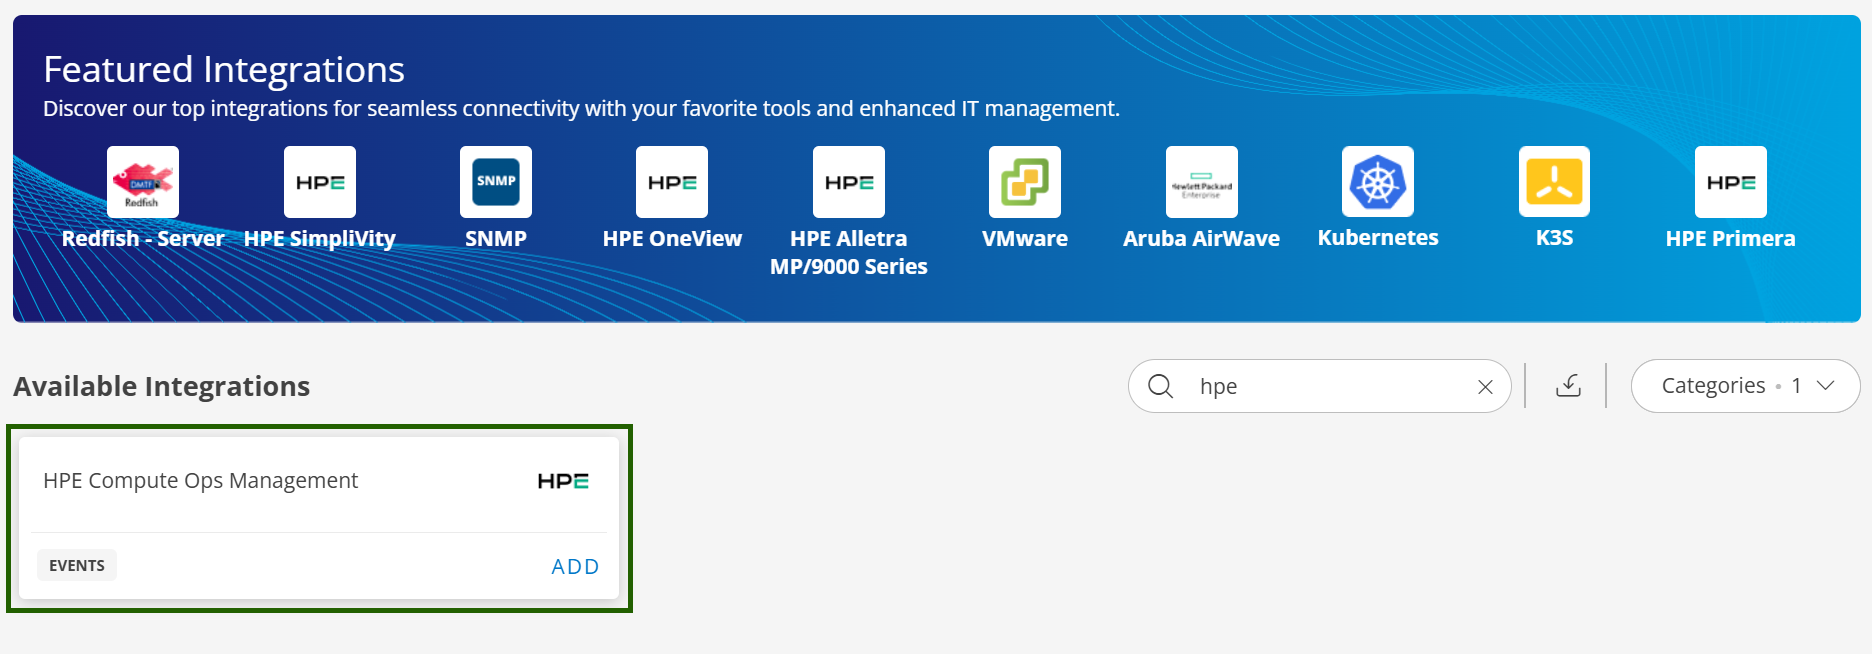
HPE COM Event Integration with OpsRamp Enhancement
Users of HPE Compute Operations Management (COM) can now configure event integration with OpsRamp to seamlessly forward events from HPE COM into the OpsRamp platform. Once events are ingested into OpsRamp users can trigger appropriate remediation actions, automation, or incident workflows based on the alert conditions.
This delivers centralized observability and deep event triage capabilities for HPE COM users through a unified command center that integrates HPE COM and OpsRamp within the same GreenLake Platform workspace.
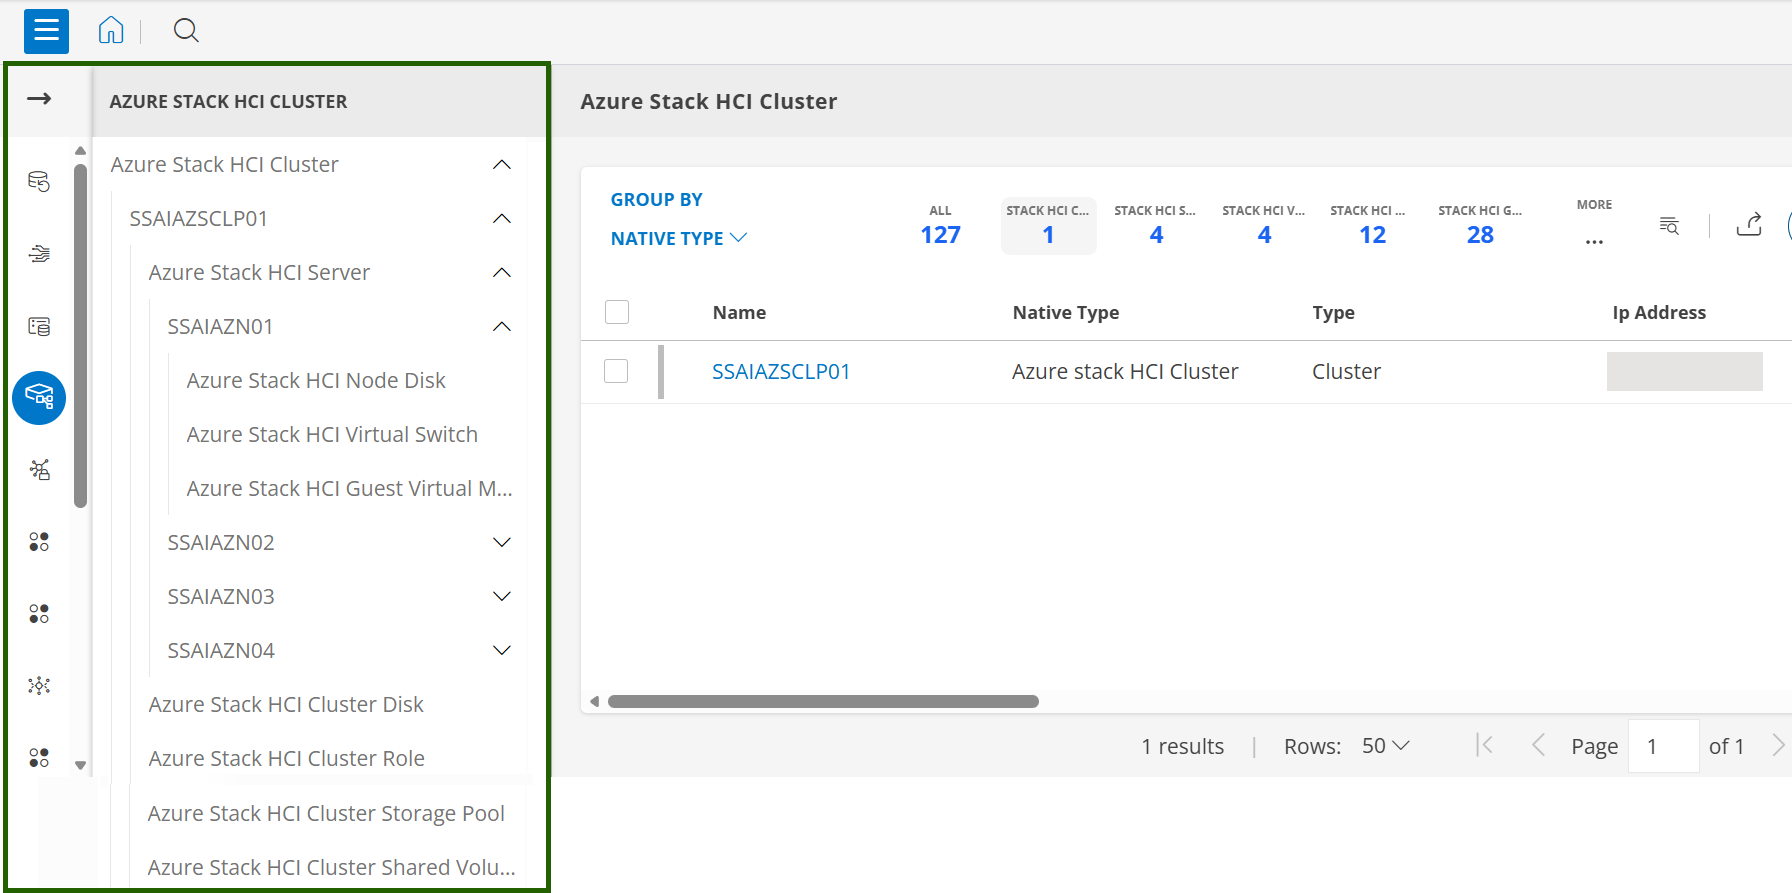
Improved Visibility and Navigation in SDK Apps Enhancement
You can now explore SDK resources through a hierarchical tree view, organized by their native types.
This structured layout offers a more intuitive way to understand and manage your resources, making navigation faster and resource management more efficient.
The hierarchical tree structure is available across all the SDK applications.
TruncateBytes function support in integration framework Enhancement
A new truncateByBytes function is now available, allowing truncation of strings (such as subject or description fields in alert payloads) based on a specified byte size.
Key Enhancements:
- Accurate Multi-Byte Handling: Ensures that multi-byte characters (e.g., Unicode) are never split, preserving data integrity.
- Byte-Based Limit Compliance: Guarantees that the resulting string does not exceed the defined byte limit.
- Improved Compatibility: Helps align with external systems like BMC Helix, which enforce Byte-size limits, eliminating inconsistencies caused by previous character-based truncation.
This enhancement provides precise control over payload size, ensuring smooth integration with third-party platforms and reducing errors due to truncation mismatches.
End-of-Life Announcement
Classic (Standard & Custom) Reports
Effective December 2025, the Classic Reports (Standard & Custom) feature will reach End of Life and will no longer be supported in OpsRamp. This change follows the previously issued Deprecation Notice and is part of our ongoing effort to improve reporting performance.
- Access to Classic Reports will be removed after December 2025.
- Any existing Classic (Standard or Custom) reports will cease to function and will not receive updates, fixes, or support.
- Users are strongly encouraged to transition to the Reporting Apps, the advanced replacement for Classic Reports, before the End-of-Life date.
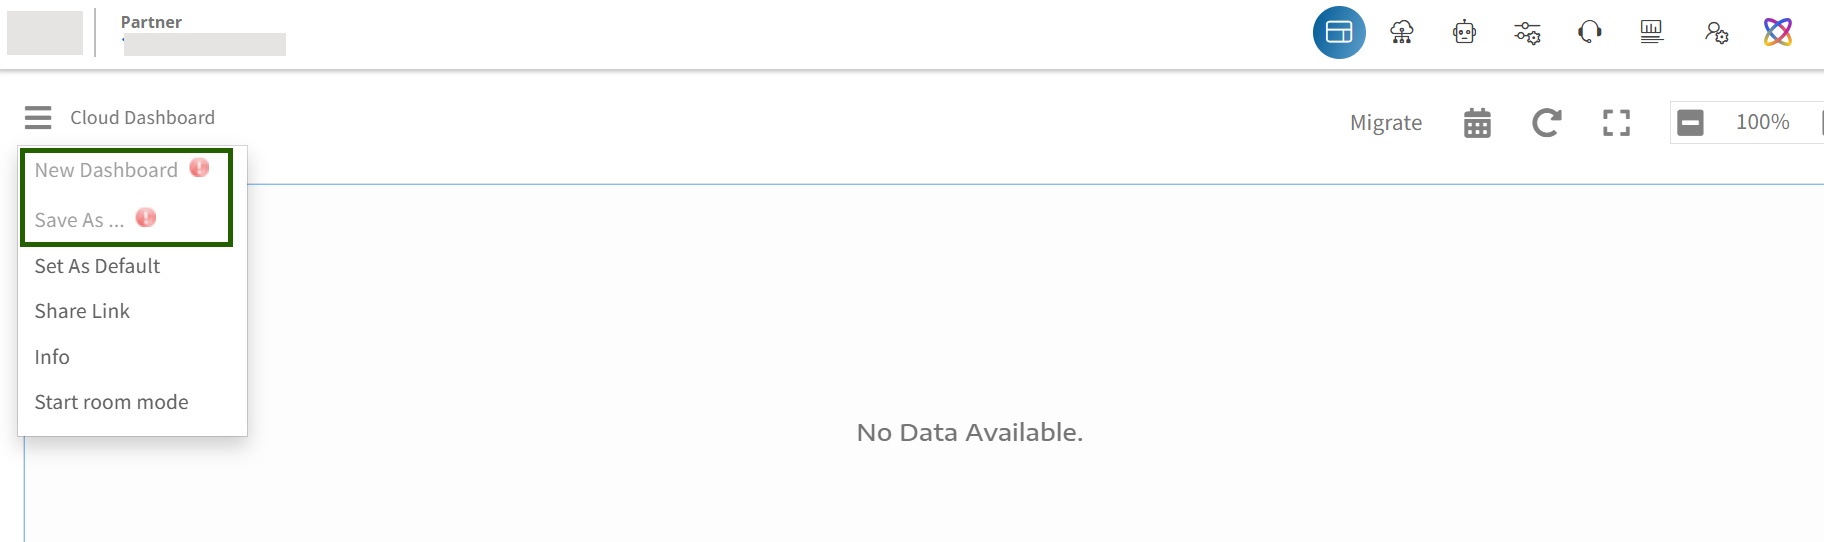
Deprecation of Classic Dashboards
The Classic Dashboards feature is being deprecated. You will have limited functionality available on existing classic dashboards.
- Share Dashboards
- Set for Room Mode
See Deprecation Notice for more information.